Q: Our resistance welding process produces inconsistent results: most of the welds are good, but we get too many weak welds that require rework or cause scrap down the line. How can I figure out what's going wrong?
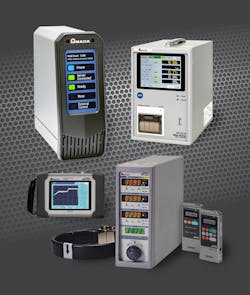
Process consistency is a common issue in resistance welding. A number of things can go wrong, all caused by variations in one or more of these areas: equipment performance, material properties, and process settings. We always recommend that customers start investigating by looking at weld process parameters recorded with a weld checker (aka, weld monitor). Why?
The data collected by these devices can tell a story that even the most well-trained eyes and ears of an experienced operator cannot. Even when it's obvious that the weld is not working, the operator may not be able to pinpoint the root of the problem, whereas the data from a monitor could. Without data from a monitor, the operator is largely running blind and making guesses at the root of the problem.
Q: What process parameters can be measured by a weld monitor?
A resistance weld monitor can capture electric current during the weld, voltage between electrodes, electrode force, and electrode movement.
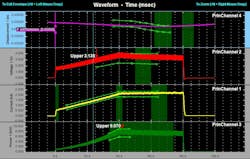
Basic models output a numeric aggregated value (e.g. min or max) for one or more parameters. More advanced monitors can capture and analyze the entire, high-resolution waveform of every parameter. Waveforms provide much more useful information about the dynamic weld process than aggregated values. For example, waveforms can reveal sparking due to inconsistent fit-up, loose welding machine hardware, and inconsistent timing between the application of mechanical force and electrical power.
Q3: What do these parameters tell me about the weld?
Resistance welding is achieved by applying heat and pressure over time. Heat is supplied by passing current through the electrodes and weldment. Pressure is supplied by squeezing the weldment between two electrodes at a predetermined force. The time profile, (the rate at which current and pressure are applied) can affect the weld result.
Heat and pressure cannot be measured directly. But they are the consequence of the current through the parts, voltage across the electrodes, and force applied by the weld head. Other electrical parameters like power and resistance can be derived from these measurements. In addition, the weld process causes a small movement (“displacement”) of the electrodes that can reveal whether the weld has progressed as expected.
A change in any of these parameters could indicate issues in the welding process, like improper alignment, dirt/debris, change in material, change in coating, and other defects.
Q4: Can the weld monitor determine a good or a bad weld?
The monitor with its resultant values and/or waveforms does not, in and of itself, say whether the weld was bad or good. It can, however, compare the most recent weld to a known good weld. If the parameters are similar, it's passed as “good”; if outside the range, it's flagged as “different.” Different is often considered “bad” in a production setting and the part would be flagged for rework or scrapped.
To determine the range of acceptable values or limits, a user will run a design of experiments (DoE) using different weld equipment settings that will affect weld quality. Waveforms are recorded and reviewed with weld quality results. At the end of the study, upper and lower parameter limits can be set such that the range includes “good” welds and excludes “bad” welds.
The optimal limits settings reflect a balance between the successes at accepting a “good” weld and avoiding too many “false positives,” that is, welds that generate readings inside the limits fail welding quality specifications. It's a time-consuming endeavor but results in process settings that will identify a good weld within statistical limits. For critical welds, this is the de facto procedure to follow for such products as safety components or medical devices.
Q5: What else can weld monitors be used for?
In addition to quality assurance, weld monitors are used to identify correct settings in process development, for maintenance troubleshooting, equipment certification, and data storage. Identifying and monitoring correct weld settings provides a means for quality control of the product being manufactured. During process development, one can compare the stability of the settings and optimize the process.
For maintenance troubleshooting, weld monitors come in handy to capture values and waveforms to indicate the likely source of the issue. The shape of the waveform can indicate issues in material properties, process setting changes, and equipment malfunctions. The key is to quickly identify the true source of the problem and get back on track with production.
Weld monitors can also verify or certify that equipment is running as expected. If you programmed a 2,000 A weld for 10 ms, you want to be sure that the power supply delivers that as expected
Finally, since the monitor is recording the values, there is also an option to store the data. When connected to an MES system, weld values can be stored for a particular manufactured part.
Q6: Where is the weld monitor data stored and how can I use it?
Data can be stored locally in the process monitor, or on a networked server either on-premise or in the cloud. Modern, high-end monitors have software that stores recorded values in a database server. This database can be accessed and used by analytical statistical process control (SPC) software, and to monitor equipment health and analyzed by Overall Equipment Efficiency (OEE) programs.
Production managers, process engineers, and operators can use stored data to make informed decisions about the production process that affect product quality, throughput, and cost.
Q7: Can this data be used for artificial intelligence or machine learning algorithms?
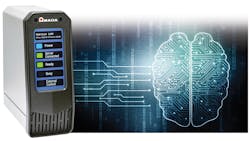
Indeed, it can! Artificial intelligence (AI) and machine learning (ML) are being applied in the welding field to create smart adaptive limits and to predict weld quality.
The AI/ML algorithms look for trends in the recorded data that may not be seen through standard analysis of graphs. In addition, AI/ML tools can generate many data ‘features’ from process waveforms. These features can be used to spot subtle details about the welding process. While the sheer volume of data can overwhelm garden-variety SPC software tools, the data can easily be handled by modern ML algorithms running on inexpensive computers.
The AI/ML programs go beyond the simple instantaneous limits we discussed in question 4. This adapts limits during the welding process allowing for external fluctuations that naturally occur over time (ambient temperature, electrode exchange, etc.). These “smart adaptive limits” will allow for higher throughput and better quality.
AI/ML may be able to achieve the holy grail of process monitoring and finally answer the question, “Was that last weld good or bad?” and provide a means for weld quality prediction.
Mark Boyle, Ph.D. is the Senior Manager, Product Engineering and Applications at AMADA WELD TECH INC.
