Editor's note: Part 2: Understanding P-F Curve Modalities will be published Wednesday, February 8th, 2023.
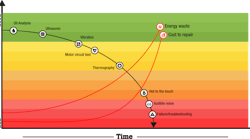
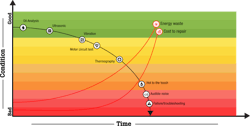
The P-F Curve is a tool based on the concept of repairing or replacing assets according to their condition rather than their age. It's a visual that helps identify where an asset is in its lifespan and its progression toward failure.
“P” refers to potential failure, which is when an asset’s physical or operating condition experiences some kind of measurable change, and “F” refers to functional failure, which is the point at which an asset fails to meet defined performance standards.
The P-F Curve was introduced in 1978, long before today’s advanced condition monitoring equipment existed. The initial use case of the P-F Curve has more to do with failure modes than tools or technologies, and with helping teams identify and plan for the failure modes they encounter most.
Over time, as maintenance and reliability technologies and practices have changed and advanced, some people have used the P-F Curve in ways that stretch or dilute its original intended use. Understanding a tool is essential for using it most effectively.
Using the P-F Curve
Asset criticality helps maintenance and reliability teams understand all of their assets in a holistic and comprehensive way. Completing an asset criticality assessment forces teams to truly rank and prioritize their assets according to their impact on production and the bottom line. Without performing an asset criticality assessment, teams can fall into the habit of giving the most attention and effort to the assets that were the most expensive or those that fail most often—even if those assets aren’t in fact the most critical in their facility.
PM optimization involves eliminating tasks that ultimately don’t add value to a maintenance program. Both asset criticality and the P-F Curve can help with identifying those tasks.
Understanding how the P-F Curve fits in alongside different maintenance approaches can help teams use it most effectively. Run-to-failure maintenance, preventive maintenance, and condition-based maintenance are all different maintenance approaches that intersect with the concept of the P-F Curve.
Common Maintenance Approaches
Run-to-failure maintenance should not be conflated with no maintenance. It's a planned and intentional approach that is appropriate for some assets and scenarios.
One benefit of this approach is that it simplifies decision-making; either an asset has failed or it hasn’t. An asset with a high mean time between failures (MTBF) is just one example of an asset type where the run-to-failure approach can make sense. The cost of regular maintenance over a long period of time could outweigh the cost of repair or replacement.
The P-F Curve can help provide a road map so that teams are less likely to be caught off guard when failure does occur.
Preventive maintenance is maintenance that is planned and performed based on time or usage. One common example is the practice of changing the oil in a car every three months or 3,000 miles driven. But preventive maintenance, as the result of ambiguity or incorrect intervals, can also actually lead to corrective maintenance becoming necessary.
For example, a vague PM calling for the lubrication of an asset may not account for the different needs of the asset’s components. Different components may need different lubricants. Some components might become overly lubricated, while others don’t get enough. Reducing ambiguity helps teams maintain the optimal operating conditions for each asset, extending the time before it reaches functional failure. Clarity and planning can help make preventive maintenance tasks an effective way of ensuring that assets perform as designed for as long as possible.
Condition-based maintenance is an approach that uses integrated sensors and software to determine the best time to perform maintenance. Doing so helps teams extend an asset’s lifespan while minimizing disruptions and downtime because work is only scheduled and performed when needed.
Real-time asset health data, gathered from specialized condition-monitoring sensors, provides for optimal scheduling of maintenance tasks. Trending asset health data over time can help teams identify the failure modes they face, respond to them effectively, and ultimately minimize them. Condition-based maintenance improves uptime while decreasing wasted maintenance resources, including time, budget, and parts. Condition monitoring makes it possible to detect failures early on when it is possible to keep assets from reaching functional failure.
Assets fail in different ways, and both assets and failure modes have different levels of urgency. The P-F Curve is a tool that helps put the urgency of an issue into context and helps maintenance and reliability teams make the most of their resources.
Stay tuned for Part 2, which will be published on Wednesday, February 8th, 2023.
Gregory Perry is a Senior Capacity Assurance Consultant with eMaint, part of the Fluke Reliability family. He's a Certified Reliability Leader (CRL) and Certified Maintenance Reliability Professional (CMRP) with nearly two decades of experience in maintenance and operational best practices. Perry is dedicated to positive client relationships while bringing to the table a broad base of experience in the areas of MRO and storerooms, world-class maintenance principles, CMMS consultation, and leadership.
As a mechanical application and product specialist with Fluke Reliability, John Bernet works with customers from all industries to successfully implement their reliability programs. He has more than 30 years of experience in the maintenance and operation of commercial machinery and as a nuclear power plant electrician in the U.S. Navy. He holds a Category II Vibration Analyst certification and is a Certified Maintenance Reliability Professional (CMRP).


