Practical Process Simulation of Multiple Operation Sequences
Studies have shown that the majority of forgers have adopted process simulation as an engineering tool. As simulation matured, users moved from modeling unit processes to sequential processes. Sequential processes were simulated in a manual, operation-by-operation procedure. This could become time-consuming when many process or design variations had to be evaluated. This was particularly true when variations came early in the sequence.
Recent software developments have removed this obstacle. Easy-to-use, multiple operation (MO) modeling tools now allow automated simulation of sequential processes. This permits efficient modeling entire manufacturing process chains.
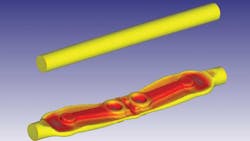
In the early days of forging simulation (1980s), ‘state of the art’ models were limited to one operation. A single-hit connecting rod platter (Figure 1) is a good example of a typical unit process. The introduction of simulation allowed companies to predict part shape, die fill, defects, forming loads and die stresses. No longer did manufacturers have to rely strictly on skill, experience and trials when developing processes. Simulating an individual process was efficient and generally informative.
A deficiency with the unit process approach is that the initial workpiece starts with no prior processing history. The initial geometry represents a “target” shape, not the actual shape output from the previous operation. Mechanical, thermal and microstructural history is also missing. These variables are important because they influence flow stress, which characterizes how the material plastically deforms.
A more accurate solution was possible by capturing the effect of each operation on subsequent ones. Thus, users began simulating operation sequences from their manufacturing process chain.
An automotive suspension component forged by LC Manufacturing provides an example of a sequential process. Cross-wedge rolling was used to roll a billet into a preform that was then forged on a hammer. A single simulation modeled the heat transfer, rolling and forging operations involved. This permitted the geometrical, mechanical and thermal history from rolling to influence how the material flowed when forged.
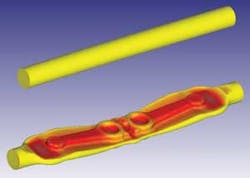
Simulation results (Figure 2) accurately predicted the part shape, flash, and die fill relative to the actual parts (Figure 3.)
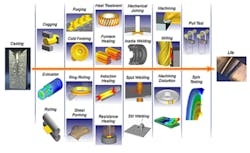
Many products follow a similar process chain on their journey from raw material to final application. (Figure 4.) First, an ingot is cast and then may be cogged, rolled, drawn or extruded down to a size suitable for manufacturing. Billets and rings are cut from stock and used in forming operations.
Primary forming operations may include forging, ring rolling, or shape rolling. Then, parts may be heat-treated or machined to particular specifications. Lastly, they are fastened or welded into assemblies that are tested and put into service.
For a given material, part performance in service is determined by its final geometry, residual stress state, and mechanical properties. A part’s mechanical properties are the result of its chemistry, process and microstructure. In an ideal world, it would be possible to simulate how the geometry, residual stresses and microstructure evolve through an entire process chain. Then, it would be possible to predict the effect that manufacturing changes have on final part performance and life.
Vision Drives New Development
This vision for the future prompted the development of new process simulation tools that could automatically model complex process chains in a practical manner.
The recent release of DEFORM™ V11 represents a milestone in process simulation technology. It introduces state-of-the-art tools for the simulation of integrated manufacturing sequences. Considered the “next generation” of DEFORM, the release incorporates new multiple operations, design of experiments (DOE), and optimization capabilities.
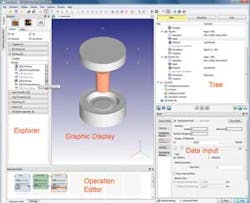
The system is founded on a fourth-generation MO data structure and interface (Figure 5.) This environment allows the creation of a process sequence that can be simulated with a single click of the ‘Run Simulation’ button.
When the first operation finishes, the system extracts data for use in the second operation. Then, it automatically prepares and starts the second operation based on the project information laid out by the user. Action keywords allow positioning in future operations without knowing an exact workpiece shape. Finally, this cycle repeats until all of the operations defined in the process sequence have been completed.
A key difference between this and other MO implementations is that the V11 interface is powerful, flexible, and easy to use. Creating a process sequence is done through a flowchart-style interface called the Operation Editor. Process-specific operations can be added, deleted, rearranged, and cycled in the project’s flowchart. The sequence can include dissimilar operations, such as heating, rolling, forging, cooling and heat treatment.
Operations in the new system are similar to the process-specific templates that have been available in DEFORM for years. Their menus blend the best of guided and open interfaces. Projects can incorporate a combination of 2D and 3D operations. A 2D-to-3D conversion operator seamlessly converts axisymmetric models to partially symmetric or full 3D models. Automated report generation, with the report in a user-defined format, can be added to the end of the process sequence.
A turbine disk manufacturing process (Figure 6) was modeled with the DEFORM V11 MO system. The project incorporated heating, forging, and heat treatment operations in one simulation job. Thermal, mechanical and microstructural response was predicted and tracked throughout the entire sequence. This was used in a study that evaluated the influence of processing and geometry parameters on the final finished part shape, residual stresses and microstructure.
Once a baseline project has been simulated, it is easy to model alternative design and process variations. Users can quickly make a copy of the baseline project, modify it and launch a new simulation. The user can choose to resimulate the entire process or only the operations at and after the change. The ease of making changes greatly increases the speed at which users can evaluate iterations. They may try different tooling or change key processing parameters such as temperature, material, forming speed or transfer/dwell times.
Taking this idea further, users can use this capability to create projects that act as templates. Project layouts representing common manufacturing sequences can be saved for future use. This avoids the need for creating the entire sequence setup from scratch, every time a similar simulation is required.
Modeling Template for Forming, Heat Transfer
For example, an aluminum forger may have a particular product line that always involves a preform, a block, and a finish operation. They could create an MO project incorporating those forming operations and any necessary heat transfer operations. Then, they could use this as a template when setting up similar processes in the future.
Larger studies can be performed to gauge steady-state response during manufacturing. Operation cycling tools allow one or more operations to be repeated a defined number of times. The MO system automatically passes output from one cycle to the next, as defined by the user. Predicting the steady-state thermal response in tooling during production runs is the most common use for operation cycling.
Multiple operation technology lays the groundwork for new DOE and optimization tools. These features allow for the automated study of process and design variations.
DOE is a systematic method to investigate design parameters or process variations. Structured changes are made to one or more input variables of a system. The effects that these changes have on specific output variables are then assessed. Optimization is an iterative method used to evaluate design or process variables. A control program interrogates a system’s response to specific inputs. It updates inputs in subsequent simulations until it converges on the ‘optimum’ result without defects.
The MO structure permits the study of DOE and optimization variables from different operations in a manufacturing sequence. For example, a DOE study may evaluate the effect of furnace heating time, blocker geometry, and finisher press speed. Studies are created by defining a MO sequence, the inputs to be varied and the target outputs to be assessed. A batch process automatically sets up and runs all of the necessary simulations. This could involve just a few simulations or hundreds of simulations.
Data mining and display is critical because huge amounts of data can be produced in a DOE or optimization study. The batch simulation process automatically compiles the target output results from every simulation and stores this data in a manageable SQL database. The simplified information set can then be efficiently viewed using new statistical postprocessing tools. This eliminates the need to access every simulated database during statistical postprocessing. Statistical feedback includes data tables, tornado diagrams, sensitivity plots, contour plots, and surface response plots. Individual simulation databases are still available for viewing in the regular postprocessor, if needed.
The developments introduced with DEFORM V11 represent the current ‘state of the art’ in process simulation. They have transformed the face of process simulation for years to come by allowing practical integrated manufacturing studies. Forgers using the automated and easily modified MO projects quickly identified the benefits of this capability: The efficiency and power of the system allows them to reduce development time, cut costs and optimize their processes. This is the foundation for the next generation of simulation requirements.
Jim Miller is the Principal Research Scientist and John Walters is Vice President, both with Scientific Forming Technologies Corporation — the developer of DEFORM engineering software for analyzing metal forming, heat treatment, machining, and mechanical joining processes.


