Motor Power Measurements Enable In-Vehicle EV Testing
In-vehicle testing provides engineers with a method to benchmark competitors’ vehicles, calibrate drivetrains, and validate the performance of the product. In the emerging electric vehicle market, electrical power measurements on motors and related power conversion circuitry are becoming necessary to perform an evaluation of a vehicle. Mobile power measurement was previously difficult due to the dynamic nature of the vehicle speed. However, unique features provided in HBM’s eDrive, a system for testing electric machines and drives, make mobile electrical power measurements possible in real-world operating environments.
After some initial discussion of why in-vehicle testing is needed, power measurement challenges, and the limitations of traditional power analyzers, this article will explain how eDrive performs dynamic power measurements and publishes cycle-based calculations to a CAN bus for correlation to an existing DAQ system, and the implications for testing EVs under real-world conditions.
Then a series of dynamic power measurement examples are presented wherein eDrive is used to test the motor system in an electric scooter. These measurements demonstrate how motor and drive performance can be assessed during vehicle acceleration and deceleration, coasting and other conditions as well as to test motor control techniques.
Why Measure On A Vehicle?
Mobile data acquisition is a cornerstone for vehicle evaluation and is frequently done for evaluating structural durability, noise, and vibration characteristics. Engineers are looking to understand the final product and how all the subsystems act together. They want to evaluate the customer experience and ensure that the vehicle will meet durability claims.
These vehicle tests involve comparing supplier parts, evaluating user experience, monitoring extreme condition performance and fleet testing. To serve traditional mobile markets in their evaluation of electric motor performance, application-tailored instruments are needed such as the HBM eDAQXR data acquisition system and the GEN2tB power analyzer.
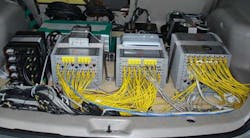
Fig. 1 shows the HBM eDAQXR taking hundreds of channels of strain, acceleration, temperature, CAN bus, GPS and other signals for doing a structural evaluation of a vehicle.
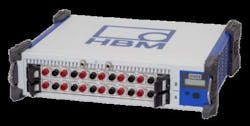
With the global push towards electric vehicles, HBM recognized the need for in-vehicle power measurements and now offers the GEN2tB power analyzer (shown in Fig. 2), which can do power measurements in the lab or in-vehicle. Recording the electrical voltages and currents coming from an electric machine can give new insight into vehicle dynamics that didn’t exist with combustion engines.
The introduction of electric power measurements will allow the correlation of powertrain values to structural dynamics, NVH (noise, vibration, and harshness), and user experience to an extent not previously available. Measurement examples presented in this article using HBM’s eDAQXR and GEN2tB will illustrate this correlation of motor power measurements to the operating conditions of the electric vehicle in which the motor is used. The GEN2tB power analyzer is primarily responsible for implementing the technology referred to in this article as HBM’s eDrive system.
Unique Challenges Of Testing Mobile Power And Efficiency
Mobile power measurement offers challenges for both the mechanical and electrical systems. One of the primary challenges is that the electrical frequency, which dictates speed, is constantly changing. This creates a need for a cycle detection (frequency tracker) algorithm to correctly measure electrical power. This algorithm will be discussed later.
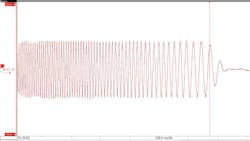
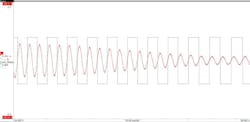
In Fig. 3, there is a single phase of current for an electric vehicle that is slowing down. The frequency goes from high frequency to low frequency in a matter of seconds. Measuring RMS and power values live would have previously been impossible because traditional power analyzers rely on a phase lock loop (PLL) based measurement, which requires a fixed frequency. If a PLL-based system were to try and track a dynamic signal, it would end up performing the power calculations on an inaccurate time period and output an inaccurate measurement for power.
There is also the challenge of hybrid vehicles and hybrid transmissions that have clutches, transients, multiple machines, and changing states which create currents that are constantly changing amplitude and frequency. Transients will impact vehicle durability (gearboxes, transmissions, etc.), performance, and user experience creating a demand for accurate measurements of powertrain dynamics. Torque measurement in vehicles is also a challenge since the shaft is often hard to access or alter.
Torque measurement is not the topic of this paper, but it is possible with custom sensors, telemetry systems, estimation models from CAN or strain gauging the half shaft.
What Makes Traditional Solutions Impossible Or Inaccurate?
Traditional power analyzers were designed for measuring power lines at 50 and 60 Hz and use a PLL technology that takes time to settle onto a fixed frequency. This settling time is often on the order of seconds. Once the PLL has settled on a waveform, it determines the frequency and will use the time period for RMS and power measurements. If the frequency is constantly changing, the PLL will not settle and it will make its measurements on an arbitrary time period. This often results in impossible results like efficiencies greater than 100%.
Traditional power measurement systems also typically lack visual feedback or recorded data which significantly limits the traceability of the measurements. During an in-vehicle powertrain measurement, test engineers typically want to measure a certain set of powers, voltages, or currents and need visual feedback to indicate when they have achieved their given setpoint.
Without feedback, it is difficult to know if the vehicle has achieved a certain loading point and for how long it has operated at that point. Control engineers will also use this feedback to monitor the Id and Iq control variables. Visual feedback gives engineers insight into how the vehicle is responding to different disturbances or if they have met their set points. The use of visual feedback is vital to doing competitor vehicle benchmarking where control strategy or powertrain performance is largely unknown.
Traditional power measurement systems also lack a method of correlation and feedback to external systems. This is necessary to correlate their power signals to environmental data often collected by existing data acquisition systems.
GPS, video, temperature, and vehicle status will give an engineer significantly more insight into what was happening during the test. Hard braking, swerving to miss an obstacle, or harsh traffic conditions may affect a vehicle output or demonstrate a bug in the vehicle control. Without GPS or video, engineers are relying on the driver’s memory to recall these events. A proper test run would need to incorporate external test conditions for transparency to the test results.
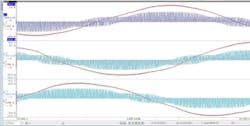
More traditional mobile data acquisition systems were not intended for high-frequency and high-voltage signals generated by inverters. Mobile DAQ systems have sample rates that max out around 100 kS/s, which is more than enough for structural or frequency data but does not give enough bandwidth to get a good power accuracy from a PWM inverter. These inverters are turning on and off a high voltage at upwards of 20 kHz which requires a much higher sample rate to accurately measure RMS voltages and currents. An example set of high-frequency inverter signals is shown in Fig. 4.
Traditional mobile DAQ systems also are not made for higher voltages which is an issue with dc bus voltages going upwards of 900 V. These measurements can be made with voltage probes, but there will be a decrease inaccuracy.
It is possible to use in-vehicle sensors to measure power values but they are usually low cost and low accuracy sensors that publish at a slow rate to the CAN bus. This is not typically useful for dynamic power data, lacks accuracy, and does not provide any insight beyond the slow data rate.
Applying Faster, Continuous Sampling
The eDrive system is unique because it is constantly recording the PWM voltages and currents at up to 2 MS/s per channel. These high-sample-rate signals are available for review after a test but also are used for real-time calculation of power values.
The eDrive system achieves real-time dynamic power measurements by doing all its calculations in hardware on a real-time digital signal processor (DSP). This DSP executes equations in real-time including a unique cycle detect algorithm. The cycle detects digitally filters the phase A current, finds zero crossings, takes the time between two successive zero crossings, and uses that time for RMS calculations. The DSP then calculates RMS voltage, current, power, and efficiency on the half-cycle basis.
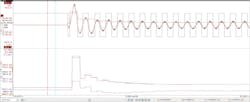
Fig. 5 shows the phase A in red and shows cycle time in black from a machine that is slowing down. Having a cycle detect is critical for dynamic power measurements because it allows users to accurately measure power when there is no steady-state condition. The real-time calculation of these values cuts down on post-process time and gives the user instant feedback on the state of the system.
The instrument’s real-time equations are made public and can be edited by a user, allowing them to record their own signals or view their unique equations as traces. Calculating signals in real-time can significantly cut down on post-process time since an external PC is not needed to run the equations. Examples of the public equations are shown in Fig. 6.
The combination of recorded high sample rate data and availability of equations provides traceability for power results rather than a black box outcome. In addition, because the equations are being processed in real-time they can be published onto a CAN bus for correlation to outside systems.
The Importance Of Dynamic Power
Electric vehicle torque and speed are dependent on voltage and current that are constantly changing frequency and amplitude. As mentioned earlier, the measurement of these signals requires a method of tracking the frequency to properly measure power. An advanced method of frequency tracking like cycle detect allows for testing beyond the simple static setpoint power and enables users to test dynamic power.
Dynamic losses are additional losses introduced during a transient condition as illustrated in Fig. 7 where two panes of recorded data are shown. The top pane shows phase A current, cycle detect, and RMS values during the line start of an induction motor. The bottom pane shows the real power, reactive power, and apparent power calculated on a half-cycle basis.
During the first few cycles of the machine, there is an increase in reactive power and subsequent losses. This increased loss during the transient would not be understood or captured by traditional efficiency maps but will contribute to electric vehicle range and performance. By having an accurate measurement and understanding of these losses, engineers can start to optimize drive cycles and the actual performance of the vehicles.
Signal Correlation
Powertrain testing on the road is significantly different than testing in a lab because there is a high level of unpredictability in the test conditions. For example, to measure torque and speed in a lab, a torque and speed setting are commanded to a dyno and a measurement is taken. To do the same test in a vehicle, it must be set to a fixed speed, but it will vary with wind, road conditions, and elevation. To measure a fixed torque in a vehicle you need to load it properly, which could mean finding a hill that is steep enough to hit the desired power point or going as far as to put a trailer or load into the vehicle with weights.
In-vehicle testing also has the goal of finding issues with performance or control. If the powertrain does not perform as expected under certain conditions, engineers will want to understand the causes of the failure and replicate them.
To be able to properly understand these environmental issues, it is necessary to correlate measurements such as video, GPS, acceleration, CAN bus and others to the power values. These types of measurements will give insight as to pedal position, wheel angle, and environmental conditions that will affect the total vehicle performance.
Fortunately, these measurements are often already taken by vehicle engineers with existing DAQ systems. A system that measures dynamic power can start to introduce real-time power to the available channels measured for those engineers. The combination of dynamic power measurements with environmental data will provide a significant amount of data to improve vehicle performance.
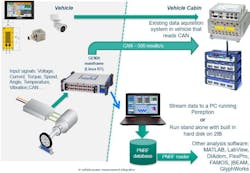
To achieve this, the HBM eDrive publishes the cycle-based calculations to a CAN bus for correlation to an existing DAQ system. The high-frequency data is stored locally on the eDrive unit, but the power, control, and other variables are also published to CAN for correlation. The described setup is shown in Fig. 8.
The proposed test setup provides power data to groups doing structural, NVH, and fatigue testing, but also gives high-frequency data with context to powertrain and control engineers. All the highspeed or cycle-based signals can be viewed live on a computer in the cabin to allow for visual feedback to the user on the state of the powertrain.
Dynamic Power Measurement Examples
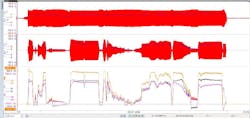
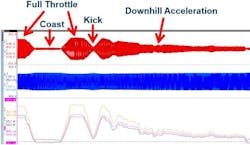
The dynamic power issues discussed above are best demonstrated by a real-world example. For this demonstration, a scooter with a three-phase IPM motor was instrumented with an HBM eDrive system. The scooter was driven around a course with a series of stops, starts, and hills. An example of a test lap is shown in Fig. 9 where the voltages, currents, and power values are displayed. The vehicle is initially started and experiences a series of starts, accelerations, kicks, and coasts.
As seen in the figure, there is an obvious limit on power and current that can be seen by the flat orange lines. However, even while apparent power is held constant by the controller, the apparent and real power change reflecting the state of the vehicle. Also seen in a full run of the vehicle is how the vehicle handles regenerative power. The topics of acceleration, regeneration and fault handling will be explored in more detail shortly.
Vehicle Acceleration
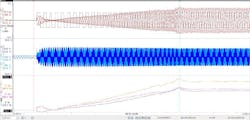
Fig. 10 shows an example of the vehicle starting from a stop. Being a scooter this vehicle requires the rider to kick the scooter to start it, which results in a sinusoidal back EMF that is seen in the blue voltage waveforms. Once the vehicle has hit a sufficient speed, the PWM kicks in and we have a current flow seen in red.
As soon as there is current, the cycle detect is tracking it and it starts giving power outputs as shown by the black square wave in Fig. 10. The power is shown to increase with vehicle speed, but it does not increase linearly. There are fluctuations in the power as it is ramping up and there is also an overshoot once the vehicle hits the max power point. This overshoot likely causes an additional inefficiency and would need to be accounted for if a vehicle was experiencing many starts and stops in its operation.
Once the vehicle has hit the max power point, the reactive and real power continues to change as vehicle speed changes. These dynamics demonstrate that power is dependent on the environment and how a driver chooses to operate the vehicle.
Vehicle Dynamics
Fig. 11 shows a variety of vehicle dynamics that happen during a drive. During this period of the test, the vehicle is operating at full throttle then enters a coast. During the coast, it ramps down its current and enters a period of slight regeneration. The vehicle then has full throttle applied again and encounters the driver kicking for propulsion. The scooter minimizes the current input during the kick and then enters a downhill area where the power level can be decreased for the same speed.
During the downhill period, the power fluctuates greatly because of different environmental inputs, such as in this case: bumps, elevation changes, and wind. This segment demonstrates how power is directly correlated to environmental inputs. Having events like this tied to vibration or failure diagnosis data would provide engineers with tools to improve designs and solve problems.
Regenerative Braking
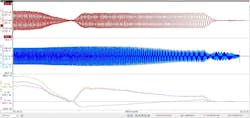
How and when a vehicle enters regenerative braking is of interest to powertrain engineers, but how the driver interacts with the regeneration also needs to be considered. Fig. 12 shows the scooter at full throttle then enters a deceleration period. The current and power slowly ramp down as vehicle speed starts to decrease. The current then goes to nearly zero but increases shortly after despite the continued decrease in speed. At this point, we can see the power go negative which indicates that there is power being put back into the battery.
The vehicle continues to slow down and eventually the power goes positive. This indicates that we are no longer generating enough power to put back into the battery and this energy is now contributing to losses. This shows how regeneration can introduce additional losses. When designing a system that is operated by real users, this can be valuable information for choosing when to turn on or off regeneration. Regeneration can also affect user experience and data can help correlate things like hard or bumpy stops to unwanted effects on the powertrain.
Dynamic Control Examples
The HBM eDrive system can do control transforms in real-time in addition to power calculations. The ability to do space vector or DQ0 transforms will supply information to users to help determine if the machine is behaving as expected. By recording the measured control variables with the CAN data output by the vehicle, control engineers can see if the machine is implementing what its controller thinks it is doing.
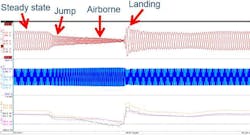
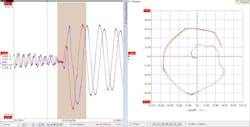
Monitoring the control technique also allows users to understand unexpected disturbances. Fig. 13 shows time data for the scooter going airborne. It is in steady-state operation and then goes airborne for a period. While airborne, the frequency of the unit speeds up and the amplitude decreases. During this period, the system even temporarily enters regeneration. When the vehicle lands, there is a large inrush of current and a dynamic power situation. The control recovers the operation of the vehicle and it continues operation.
How the vehicle controller handles the transient will be of interest to engineers in the electric powertrain groups. If there is too much current in the wrong axis there could potentially be demagnetization of the rotor. There may also be limits on how much current a system can handle.
Fig. 14 shows the example of the vehicle landing in the space vector domain. The flux and magnetization axis is shown and plotted with alpha vs beta in the right-hand window. Once the vehicle lands, the currents for magnetization and flux spike and the resultant XY display shows how the controller responds to the disturbance. An engineer could monitor for the control going out of an acceptable range and tune it according to the system needs. If the position were available, this also could have been shown in the DQ0 domain.

